Hello John,
My name is Mila, and I’m a Geospatial Consultant, and I would like to learn more about your project.
From what I can see from the PDF that was shared with me, this project seems similar to one I did back in 2018.
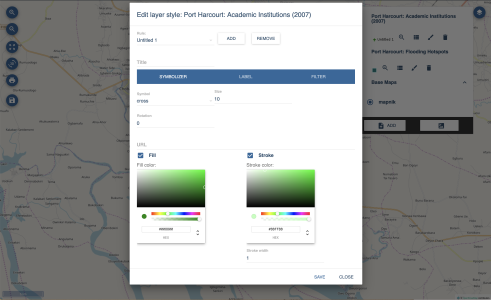
For an agriculture company, I worked on a team of four developers to create a webapplication for farmers to create their fields and create application maps (where they should apply fertilizer).
Farmers were able to draw their fields and export the application maps as PDFs.
Your project seems similar with the addition of the export as PNG and the additional predefined markers.
I would love to find out more about your specific requirements.
Quick selection of my skills you might find useful:
- Maps with Mapbox GL.js, OpenLayers, Leaflet
- Webapplication Development with React, Svelte
- Data Visualization & Maps with d3.js, vega and R

I studied Geoinformatics at the University of Muenster, Germany, which I did not finish with a degree but instead founded my own company.
I gave several talks at geospatial conferences and started publishing at mappingwithd3.com
Here is a short list of projects that show my expertise:

Precision Farming
For the agriculture giant Yara I helped develop an app for farmers. Creating an interactive map with the ability to create fields and application maps.

Travel Safety Map
The Travel Safety startup GeoSure wanted to find new revenue models for their travel data and reached out to me to help them. I build an interactive online map to showcase their collected data on Travel Safety around the globe.

Recovery Dashboard
Following the Mw 7.8 earthquake in Nepal, the World Bank Nepal response team has been collecting and curating spatial data useful for damage assessments . I worked for the GFDRR team to create a geospatial dashboard .

Armsexport Map
In cooperation with the OKF and BICC I updated the interactive map from BICC to improve the readability and interactivity.
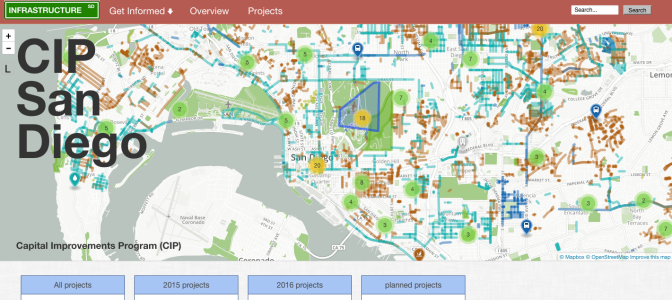
Infrastructure San Diego
For the Community Planning Groups of San Diego, I developed a dashboard and supporting tools to increase transparency in the planning process.
Next steps
I would love to find out more about you and the requirements and to see if we’re a good fit, and you can select a time from the calendar below.