Newsletter
My personal newsletter where I talk about Civic Tech, Open Data, Data Visiualizations and my business.
Let's take another stab at mercator. Looking at how to transform just a blog of data into something meaningful and a new color tool to explore.
Read MoreGeospatial Development Tool Have you checked out: http://projectionwizard.org yet? It is a nice tool to select a good projection for the area of interest. And take a look at this tweet ;) https://twitter.com/BojanSavric/status/1162788720686145536 Mercator Another great look into the real size of Mercator. I’m still amazed that so many people on the web default to Mercator projections for their projects. Here is another interactive version: https://engaging-data.com/country-sizes-mercator/ Precision and Size in GeoJSON It’s wild how many GeoJSON files are in use with a coordinate precision of 10 or higher — I’ve seen file sizes cut in half just by hacking it down to 6 (RFC 7946 recommendation) + removing duplicate coords with zero change in visual correctness
Read MoreI had a very busy two weeks but found some very interesting pieces the last week. I especially like the Heat Vulnerability Map from Vienna. And all over the place you see that Earth Observation (satellite) data is used more and more in analysis and data visualization. I love this trend and I love pocking not satellite data myself. Geospatial Development Stop Using Zip Codes for Geospatial Analysis Great article by Carto explaining where Zip codes originate, why they’re not useful for geospatial analysis and what you should use instead.
Read MoreWelcome to this new edition of “Weekly Notes”, a weekly newsletter about Maps, Data Visualization, Civic Tech, and Open Data. You can find previous issues here. Geospatial Development Building Footprint Comparison Fascinating comparison of building footprints from Microsoft and OpenStreetMap. I recently used the Microsoft building footprint for my Zoning analysis in San Diego. When I looked for building data I found that the Microsoft dataset was more complete than the Open Street Map data.
Read More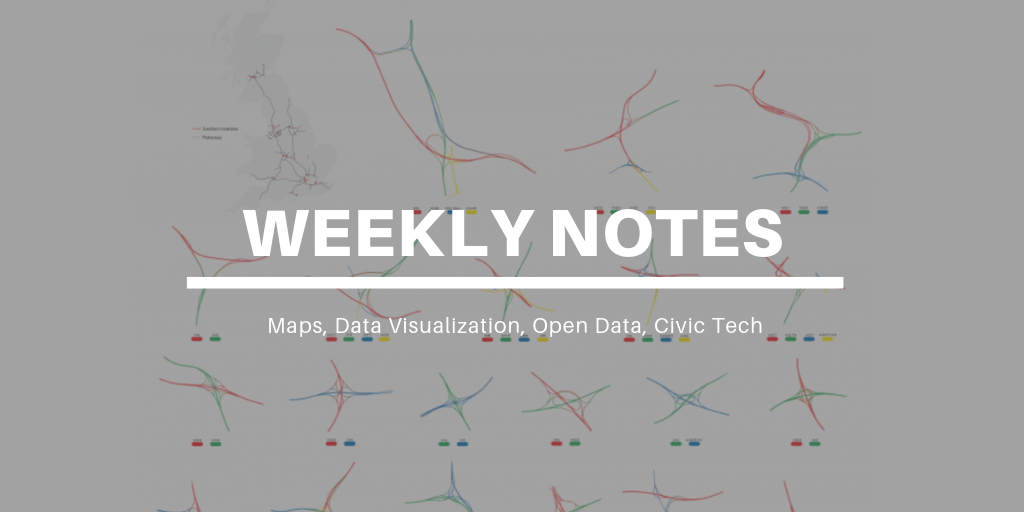 Jul 21, 2019
Green space is good for mental health, mapping 'hot spots' in urban areas, accessibility of lakes in Switzerland and more.
Read More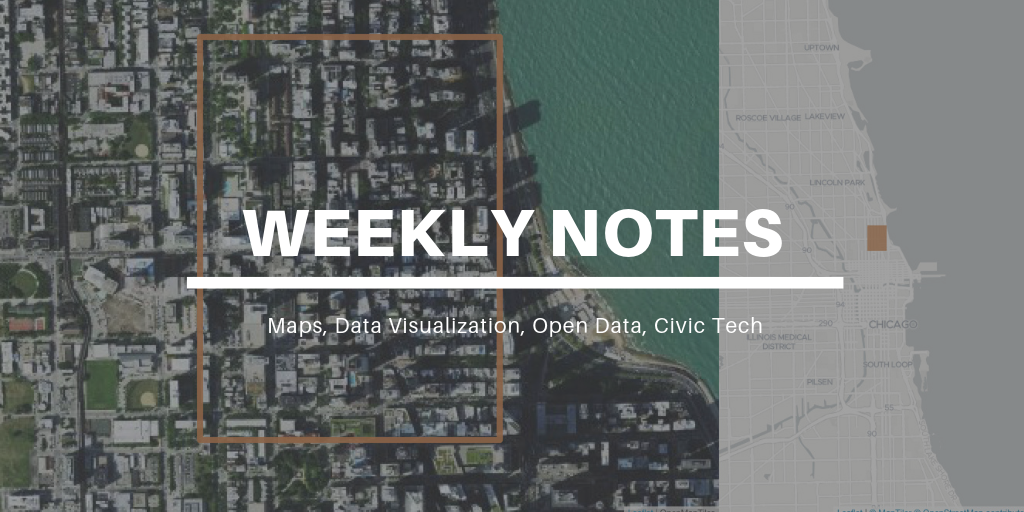 Jul 14, 2019
This week we look at city density through a different measurement. Find out more about subway commuting times in New York City and a new tool to let your users draw their expectations of your chart.
Read More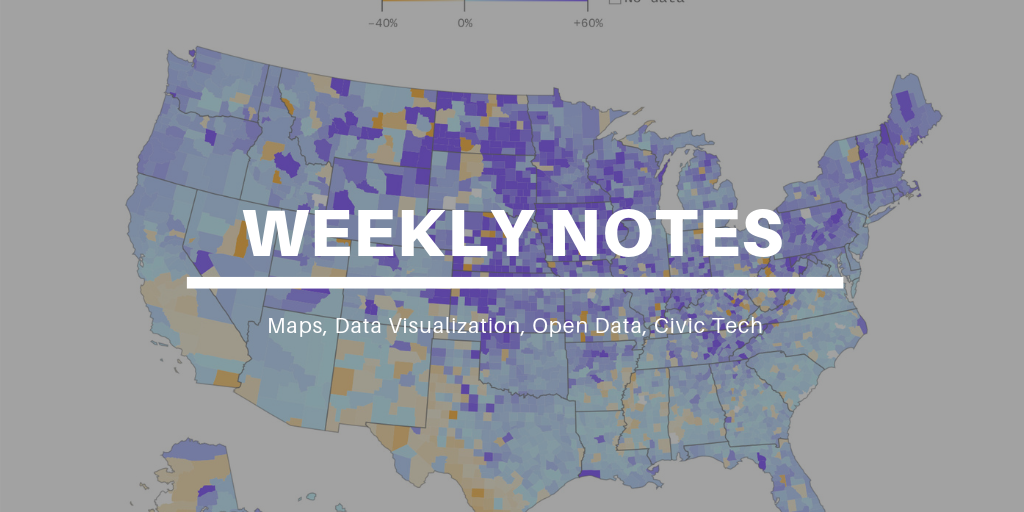 Jul 7, 2019
I love that e-scooters have finally arrived in Berlin. I already used them to get around and shorten my trips. This weekend we had some close friends over, and we used the scooters to show them the city from a different perspective. It’s definitely a fun and great way to get around. Although my last work week did not feel that productive, I published two new content items last week.
Read More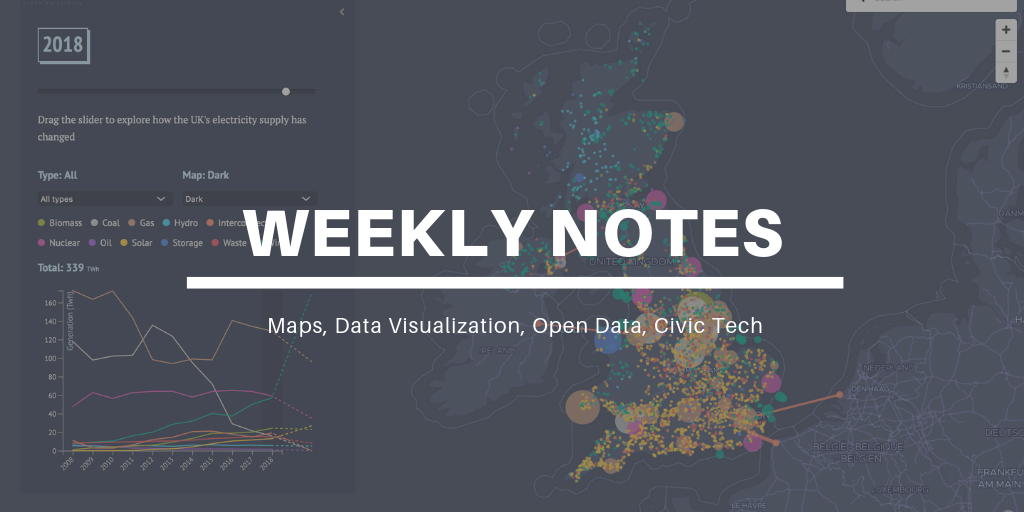 Jul 2, 2019
This week includes a great map from CarbonBrief about electricity supply in the UK. As well as Zoning in the US with a lot of detailed maps from the NYT.
Read More Jun 18, 2019
Last weekend I had another session in the pool on my way of getting the Open Water Diver certificate. This is really fun and I’m looking forward exploring the Oceans. On the weekend I wanted to create something small. I wanted to create something that I might want to use for my workshops. After trying out if it would work as I would expected and it did, I started looking into javascript frameworks.
Read More Jun 9, 2019
Hope you had a great week. I certainly had an entertaining week. A lot of stuff has happened. What’s new with me I started my diving lessons to get my Open Water Diver certificate, so I can dive with my wife on our next family vacation. That should be fun. What fun vacation are you planning next? Just reply and let me know. I’m curious, especially if you plan a diving trip.
Read More